Extracting and analysing data using R
To finish a Master’s degree, students have to write a dissertation. As I’m on that path and out of curiosity, I wanted to get some insights on the dissertations written on my university in the last years. This was also a great opportunity to practice some data extraction and visualization skills that I learned by reading the free book R for Data Science.
Extracting public data
Universities in Portugal publish student dissertations on the Renates platform. We can freely search and download these works with some limitations, as the download can be restricted (ex: contains information that a company does not want made public yet), but some data is always available. Search is limited by 200 results, so a search by year and course is necessary.
To export the data, a convenient excel spreadsheet can be downloaded. I had some problems with the files as I couldn’t use the readxl library, although it supported the legacy .xls format. As such, I opted to open Excel and re-save the files as there were only a few of them. There is a column with the repository url to a page that contains a link with the dissertation pdf, which had to be scraped using the rvest library. I did not parallelize the downloads to not overload the servers, so the process took a few minutes.
Here’s a glimpse of the wrangled data:
1 | ## Observations: 292 |
Exploratory data analysis
Male and female students by year
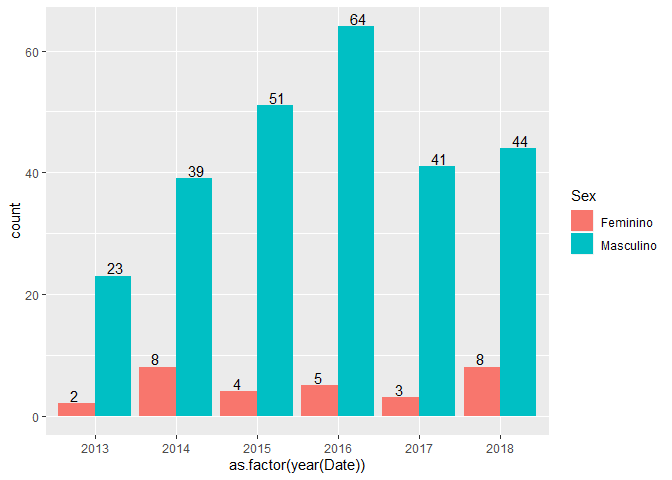
There are 262 male students and 30 female students that finished their disserations between 2013 and 2018. More than 100 students are enrolling each year, so the number of dissertations is a bit low.
Specializations
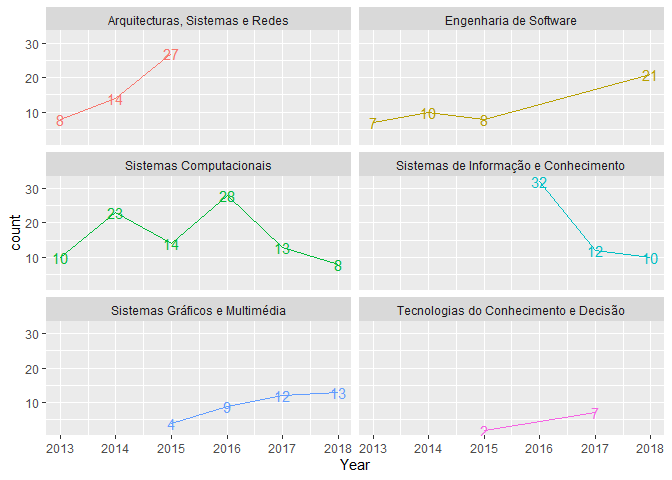
We have 6 different specializations, but 2 of them were discontinued/renamed, I know that “Arquitetura, Sistemas e Redes” is similar to “Sistemas Computacionais” and “Tecnologias do Conhecimento e Decisão” is the same as “Sistemas de Informação e Conhecimento”, so I will make those transformations for this analysis.
Grade distribution by specialization
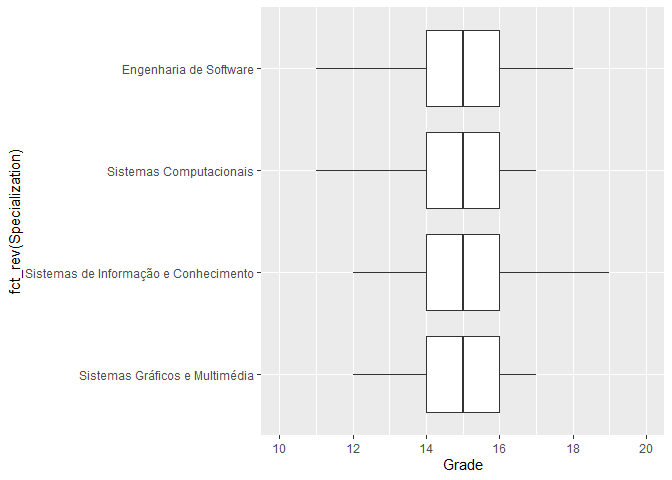
No significant difference in grades between different specializations.
Average number of pages by specialization
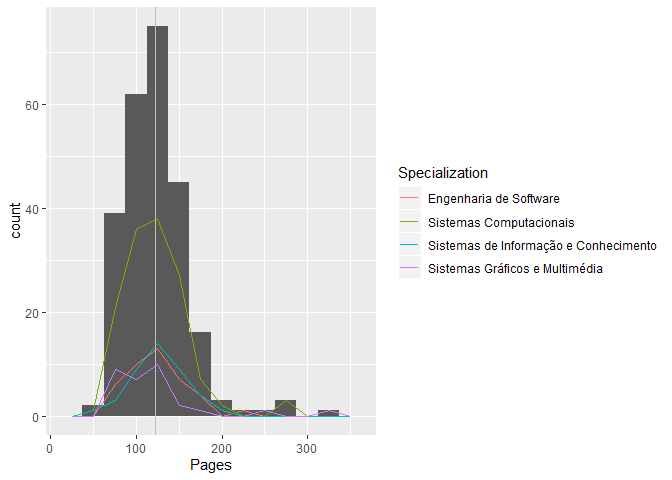
1 | summary(data$Pages) |
On average people write about 123 pages.
Advisors with most students and grade distributions with specializations
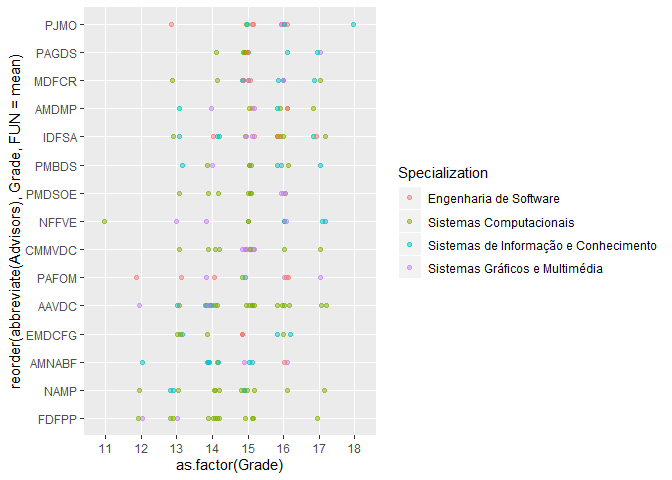
The advisors assist students from multiple specializations and grades are well distributed. A bit of jittering and transparency was used in this categorical scatter plot to aid in interpretation.
Correlation matrix
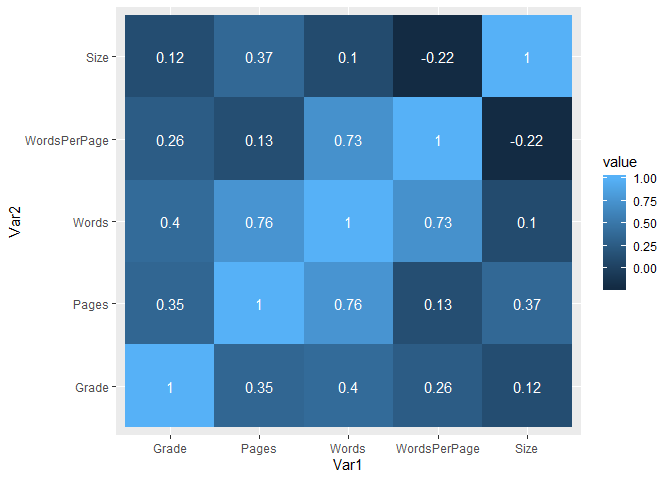
The number of words correlates with the number of pages as expected.
Compare grades and number of words
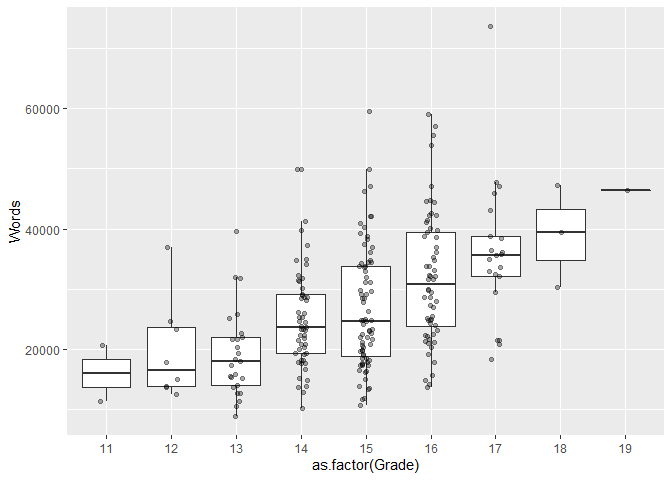
There is some difference in the distributions, but I would like more data as most works are graded between 14 and 16. Update: these grades are actually final course grades, not the dissertation grades.
Common keywords

Artificial intelligence, mobile systems and web development seem to be hot topics.
Closing thoughts
R and tidyverse are very helpful tools for data visualization and exploration. I have recently gained an interest on distributed systems and machine learning, so for the latter I will be signing up on Kaggle and learn some new things on my free time. The full analysis, which is mainly focused on creating different visualizations, is available on Github.